MARCH
Mississauga’s housing market is showing serious signs of slowdown. March 2025 numbers reveal a sharp drop in sales across all property types, with buyer demand weakening and homes staying on the market longer. Even as new listings rise, the number of actual sales continues to fall — a clear sign of growing hesitation among buyers.
Behind these numbers are real people — homeowners struggling to get showings, buyers unsure when to step in, and families navigating uncertainty. This update is a clear, honest breakdown of what’s happening in Mississauga’s market — no hype, just the data.
Mississauga – March 2024 vs March 2025 (All Home Types)
| Metric | March 2024 | March 2025 | Change |
|---|---|---|---|
| Sales | 581 | 457 | ⬇️ -21.3% |
| Average Price | $1,056,300 | $1,046,145 | ⬇️ -1.0% |
| Median Price | $950,000 | $930,000 | ⬇️ -2.1% |
| New Listings | 1,091 | 1,485 | ⬆️ +36.1% |
| SNLR | 53.3% | 30.8% | ⬇️ -22.5 pts |
| Active Listings | 1,050 | 1,186 | ⬆️ +13.0% |
| Months of Inventory | 1.8 | 2.6 | ⬆️ +44.4% |
| Avg. SP/LP | 100% | 98% | ⬇️ -2.0 pts |
| Avg. LDOM | 20 | 24 | ⬆️ +4 days |
| Avg. PDOM | 29 | 24 | ⬇️ -5 days |
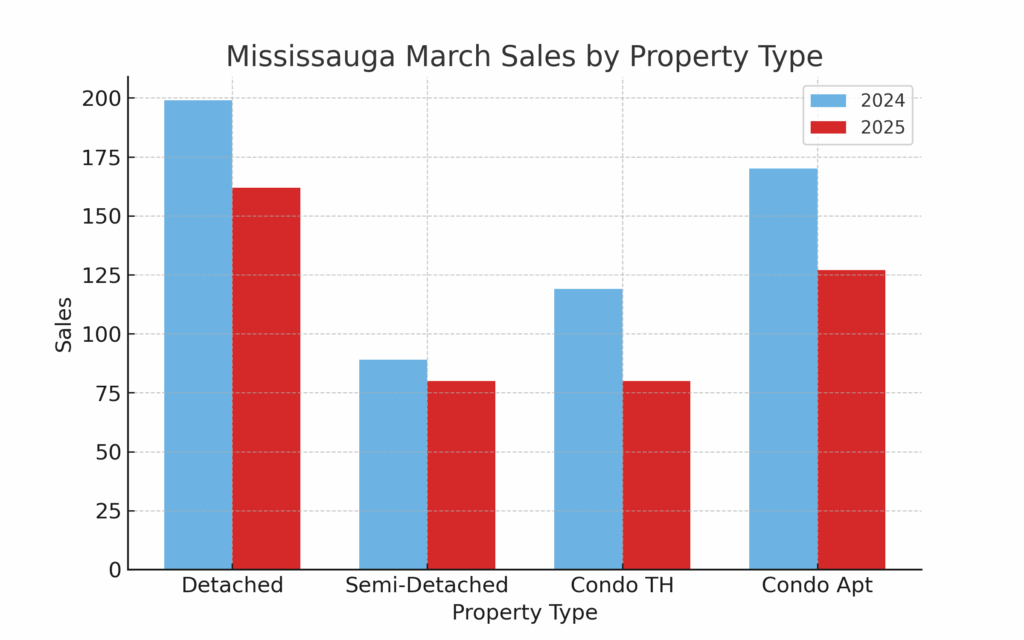
Detached Homes
| Metric | March 2024 | March 2025 | Change |
|---|---|---|---|
| Sales | 199 | 162 | ⬇️ -18.6% |
| Average Price | $1,566,563 | $1,561,922 | ⬇️ -0.3% |
| Median Price | $1,430,000 | $1,415,000 | ⬇️ -1.0% |
| SNLR | 48.8% | 28.9% | ⬇️ -19.9 pts |
| MOI | 1.5 | 2.7 | ⬆️ +80.0% |
Condo Townhouses
| Metric | March 2024 | March 2025 | Change |
|---|---|---|---|
| Sales | 119 | 80 | ⬇️ -32.8% |
| Average Price | $839,179 | $778,988 | ⬇️ -7.2% |
| Median Price | $840,000 | $752,167 | ⬇️ -10.5% |
| SNLR | 65.0% | 31.7% | ⬇️ -33.3 pts |
| MOI | 1.6 | 2.4 | ⬆️ +50.0% |
Condo Apartments
| Metric | March 2024 | March 2025 | Change |
|---|---|---|---|
| Sales | 170 | 127 | ⬇️ -25.3% |
| Average Price | $615,529 | $583,918 | ⬇️ -5.1% |
| Median Price | $590,002 | $560,000 | ⬇️ -5.1% |
| SNLR | 48.6% | 26.0% | ⬇️ -22.6 pts |
| MOI | 2.8 | 3.4 | ⬆️ +21.4% |
📉 Mid-April Snapshot – Sales Still Sluggish
Even heading into April, buyer activity remains slow. Sales are down over 50% year-over-year for detached, condo townhouses, and condo apartments. Here’s how things look up to April 21:
| Property Type | April 2024 Sales | April 2025 Sales | % Change |
|---|---|---|---|
| Detached | 234 | 115 | ⬇️ -50.9% |
| Semi-Detached | 80 | 36 | ⬇️ -55.0% |
| Condo Townhouse | 106 | 52 | ⬇️ -50.9% |
| Condo Apartment | 174 | 86 | ⬇️ -50.6% |
| Att/Row/Town | 18 | 13 | ⬇️ -27.8% |
| Total | 612 | 302 | ⬇️ -50.7% |
🎯 Final Thoughts
This is not just a slow spring — it’s a warning sign. Buyers are waiting, sellers are stuck, and inventory is piling up. If you’re thinking of making a move in Mississauga, be sure you’re working with someone who’s looking at the full picture — not just pushing for a sale.
Have questions or want a breakdown specific to your neighbourhood? Reach out any time for an honest, no-pressure chat about what your next move should be.